- Confessions of a Utah REALTOR®
- Posts
- How long will it take to sell your home?
How long will it take to sell your home?
Homes in Utah County are selling 7% faster than a year ago.
Dustyn Haug
August 13, 2024
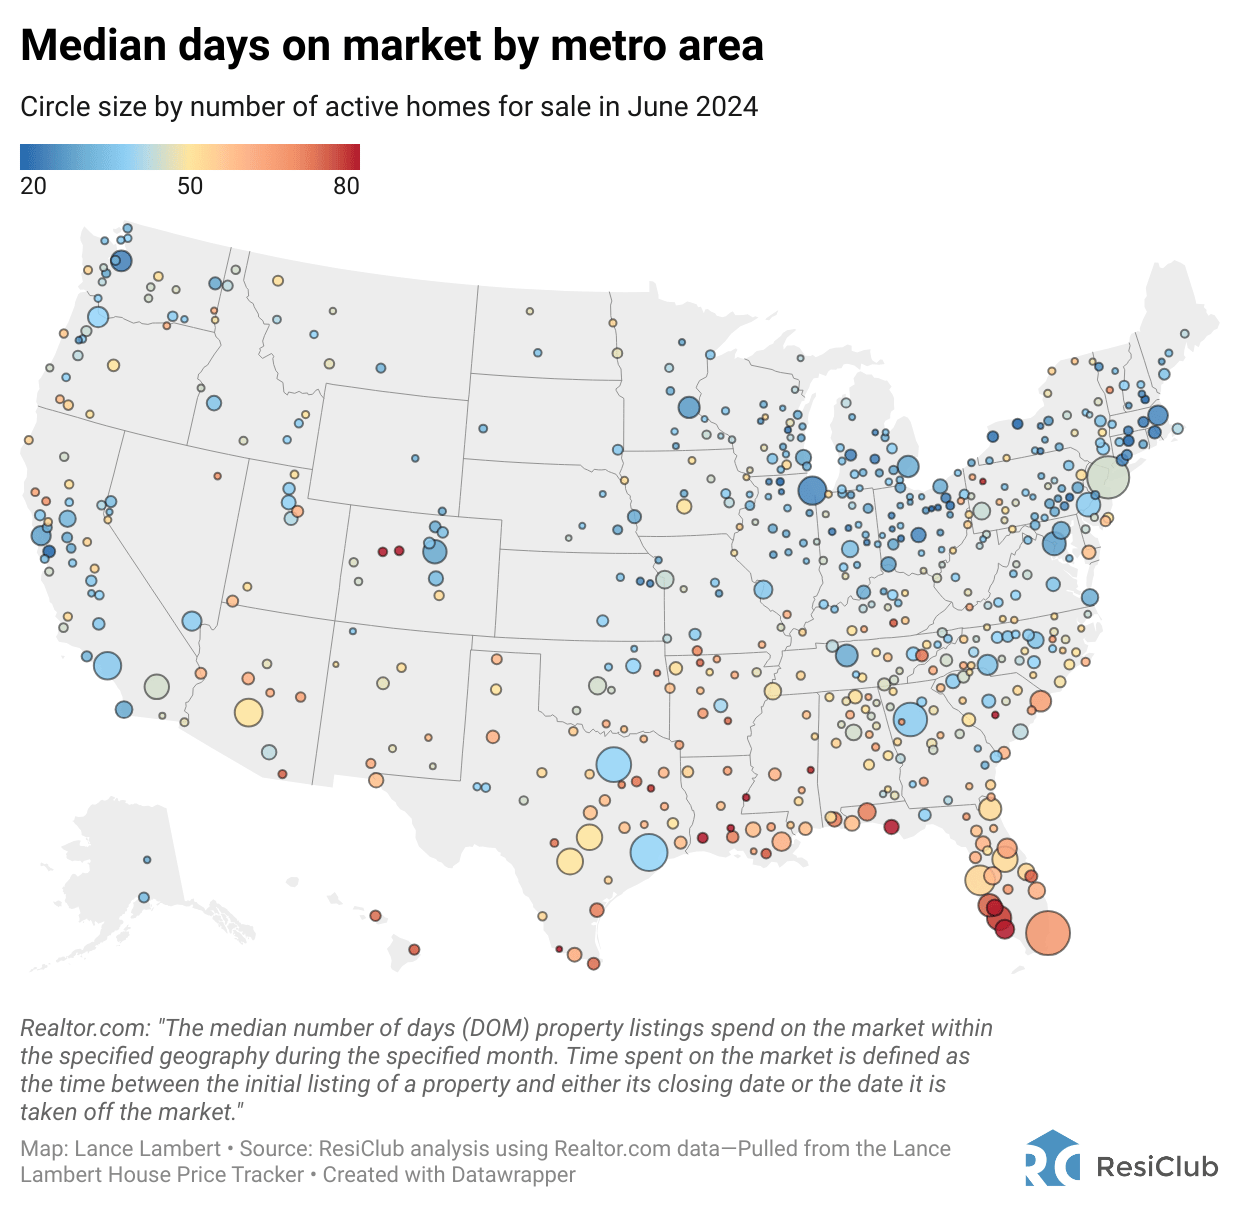
ResiClub Analytics recently unveiled two interactive maps that provide an in-depth look at the days on market (DOM) across the U.S. These maps reveal significant regional variations, highlighting areas of market strength and weakness.
Before we look at the analysis, keep in mind that the median number of days on market (DOM) can vary depending on how it’s calculated. Here’s how Realtor.com, from which we get the raw data, defines it: “The median number of days property listings spend on the market within the specified geography during the specified month. Time spent on the market is defined as the time between the initial listing of a property and either its closing date or the date it is taken off the market."
Table of Contents
National Median Days on Market
According to Realtor.com:
June 2018 —> 51 days
June 2019 —> 53 days
June 2020 —> 62 days (COVID-19 lockdowns briefly pushed it up)
June 2021 —> 33 days
June 2022 —> 31 days
June 2023 —> 44 days
June 2024 —> 45 days
Regionally, there is much greater weakness around the Gulf, including much of Florida, while many markets in the Midwest, Northeast, and SoCal still have much lower days on market.
5 Markets with the Highest Median Days on Market
Among the 200 largest metro area housing markets, these 5 have the highest median days on market:
Naples, FL —> 85 days
Punta Gorda, FL —> 80 days
Cape Coral, FL —> 78 days
North Port, FL —> 74 days
Brownsville, TX —> 73 days
5 Markets with the Lowest Median Days on Market
Among the 200 largest metro area housing markets, these 5 have the lowest median days on market:
Manchester, NH —> 16 days
Hartford, CT —> 17 days
Rochester, NY —> 17 days
Rockford, IL —> 19 days
San Jose, CA —> 20 days
Unlike many Southwest and Southeast housing markets, many Northeast and Midwest markets have lower levels of homebuilding. As new single-family homes become available in Southwest and Southeast markets, and builders continue using affordability adjustments like mortgage rate buy-downs to sell their inventory quickly, a cooling effect takes place in the resale market. The Northeast and Midwest don’t have that same level of new housing supply, so resale/existing homes remain the main option.
Average Days on Market in Utah
In our market here in Utah County and part of Salt Lake County, it’s taking on average 40 days to sell which is down 7% from just a year ago.

Of course, these are average & median numbers. Your price point and zip code will have a great impact on how quickly your home is selling, but analyzing these trends helps us evaluate the Utah real estate market as a whole.
To find out how this impacts your future real estate plans, or how quickly homes are selling in your neighborhood, don’t hesitate to call me immediately.
Here to serve,
