Hey {{first name|there}},
I hope you’re well! I wanted to share some critical insights regarding the U.S. housing market that Zillow recently published.
These findings might be particularly relevant if you’re exploring real estate opportunities or simply keeping an eye on market trends.
Table of Contents
Nationwide Housing Shortage Intensifies
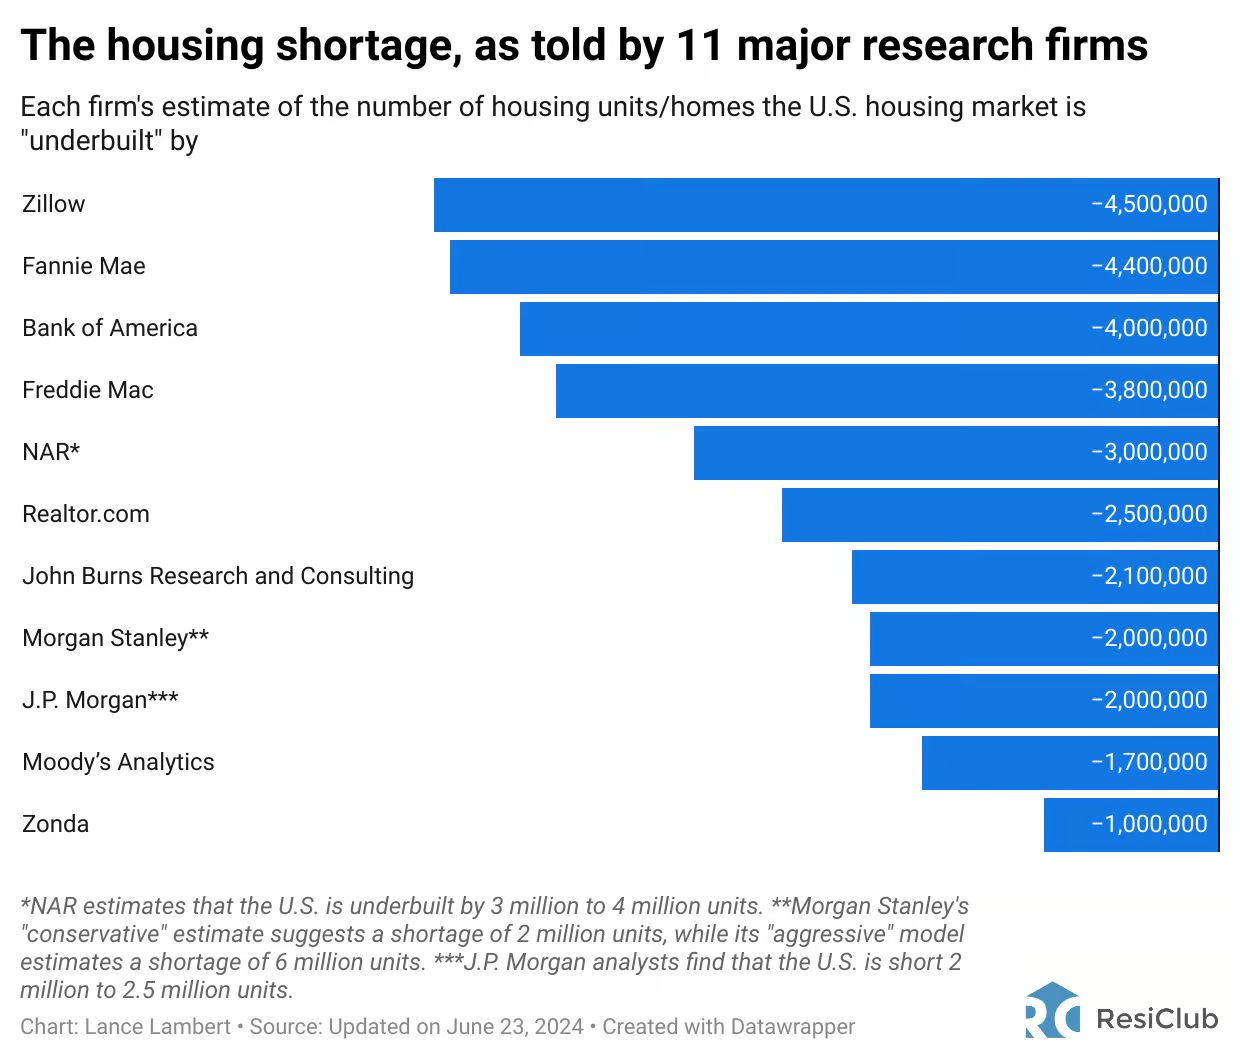
According to Zillow, the U.S. housing shortage has worsened, with the deficit rising to 4.5 million units in 2022, up from 4.3 million in 2021. Despite a notable increase in home construction in 2022—reaching the highest levels since 2007—the gap between housing demand and supply continues to widen.

Key Factors Contributing to the Shortage
The shortage is primarily driven by a significant increase in the number of new families who need a home and very sluggish construction activity in the years leading up to the pandemic. As new households form at a faster rate than the increase in new homes for sale, the amount of vacant homes decreases, which limits options for both buyers and renters, driving up prices and rent. This scenario is compounded by a national vacancy rate that fell to a multi-decade low of 2.5% in 2022, underscoring the tightness in available housing.
Regional Variations
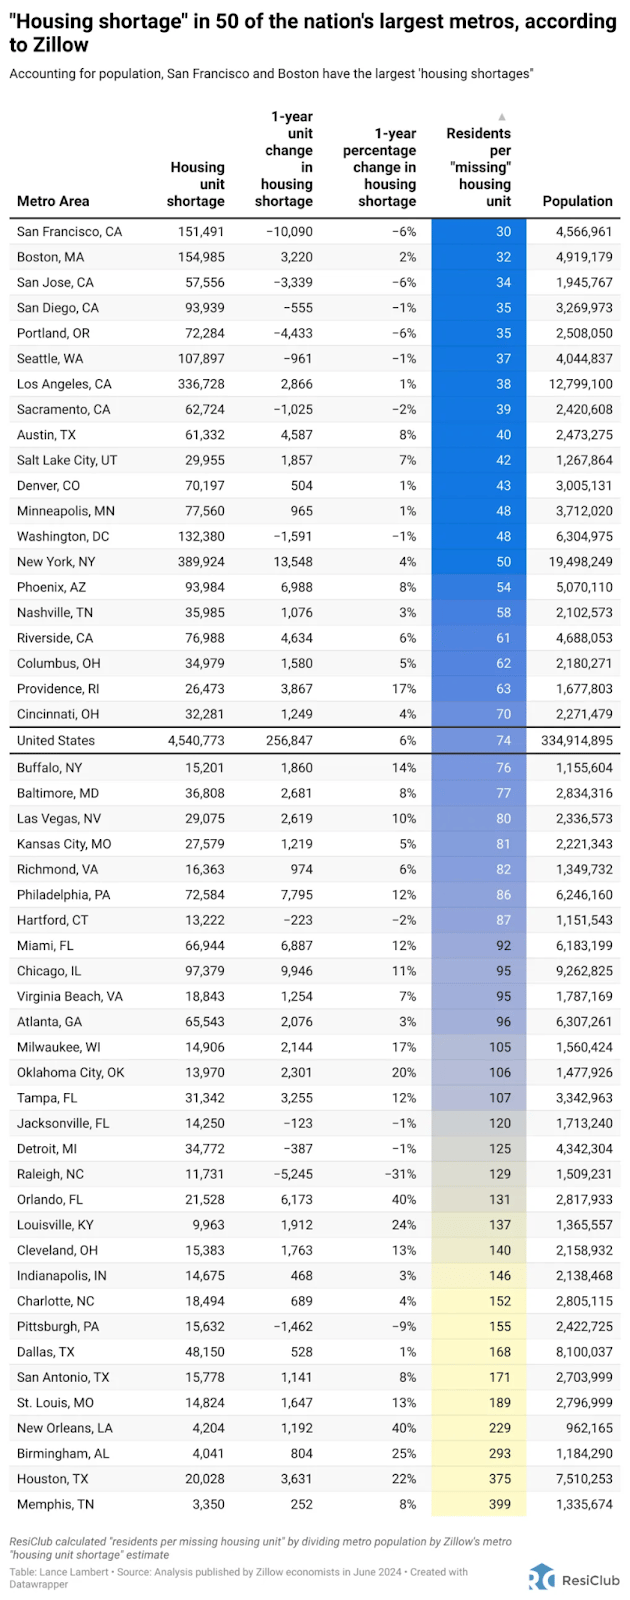
Zillow’s analysis shows that the largest housing shortages are predominantly in high-cost coastal markets such as San Francisco, Boston, San Jose, and San Diego. These areas, often referred to as “closed access cities,” face strong restrictions on construction which have historically limited housing supply growth. Conversely, cities like San Antonio, Dallas, Houston, and Memphis do not face these issues to the same extent.
Interesting Case of Austin
Austin, despite its high levels of homebuilding relative to most U.S. markets, also ranks high on Zillow’s shortage list. Remember, Zillow isn’t including 2023 numbers, and we know Austin saw a housing supply correction at the end of 2022 and throughout 2023. This highlights that even fast-growing markets can face temporary corrections and inventory increases if local conditions (like those experienced during the Pandemic Housing Boom) put too much strain on fundamentals. To view an updated, interactive graph of how the housing supply has changed over the past 22 years in Austin, click here.

Closer Look at Utah
While Utah has seen a notable increase in housing supply over the past year, the increase hasn’t been as dramatic as Austin. Builders are trying to keep up with demand, but we’re still below pre-pandemic levels of housing supply. This is largely due to Utah’s low unemployment, growing economy, and a consistent net increase in population growth, which leads to more housing demand. To view an updated interactive graph for Utah, click here.

Population Growth
Speaking of population shifts in different regions, these are the top 20 cities that experienced the most relative growth in Utah from July 2022 to July 2023. Click here to access a searchable version, which features population trends for 1,875 U.S. cities. You’re welcome.

Looking Ahead
As Zillow continues to refine their estimates with updated data (the 2023 figures are anticipated to be similar due to stable vacancy rates), it’s crucial for anyone involved in real estate to understand these dynamics. Whether you’re planning to buy, sell, or invest, knowing where these shortages are most prevalent can inform your strategies and decision-making.
If you have any questions about how these trends might affect your real estate plans, or if you need further details, including housing supply for your specific zip code, don’t hesitate to reach out. I’m here to help you navigate through this market to make the most informed decision possible.
Here to serve,


